

This can lead to slow refreshes, resource contention, and ultimately, a poor user experience, particularly for critical applications like red-alert systems. While the natural inclination might be to create large indexes on massive tables, this often introduces its own set of problems, like increased storage, maintenance overhead, and costly key lookups. So, how can you achieve lightning-fast real-time analytics without the drawbacks of oversized indexes? The key lies in understanding your specific query patterns and leveraging dynamic filtered indexes in SQL Server.
The Challenge: Real-Time Dashboards on Massive Datasets
Let's consider two real-world scenarios:
- Client A (Data Plan Sales): A client sells data plans through hundreds of thousands of points of sale across the United States. They need a real-time dashboard to monitor orders from the last day or even the last few hours.
- Client B (IoT Metrics): Another client gathers hundreds of metrics per minute from hundreds of thousands of machines installed in retail stores. Their real-time dashboard focuses on the latest events.
In both cases, data is inserted into time-driven "event-like" queues (e.g., Orders and Events tables). To prevent contention, message queues like Kafka are used for loose coupling, and hash partitioning ensures efficient inserts by reducing last-page contention.
While this setup optimizes data ingestion, real-time analytics with multiple joins to gather metadata can still be slow without proper indexing. However, large, all-encompassing indexes can hinder both Data Manipulation Language (DML) and Data Query Language (DQL) operations.
Identifying Your Query Patterns
The solution starts with a deep understanding of your application's use case and query patterns.
In our examples:
- On the Orders table, clients primarily insert and update rows for the last day to a week. While some asynchronous follow-up operations might occur, these don't demand high performance or concurrency.
- On the Events table, operations are solely inserts, with primary selects focusing on the last day's data, as older events are copied to other analytics solutions for long-term reporting.
Examining the DML and DQL patterns reveals a crucial insight:
- DML operations are typically straightforward and optimized to follow primary keys.
- DQL operations from the real-time dashboards exhibit a distinct pattern:
This leads us to a potential indexing strategy: composite keys on CreationDate and AccountId for Orders, and CreationDate and MachineId for Events. However, with tables containing billions of rows, even composite indexes can become excessively large, leading to increased storage, higher maintenance costs, and inefficient key lookups. While there's an improvement, the cost-benefit analysis often doesn't pan out.
The Power of Filtered Indexes
Filtered indexes offer a compelling alternative. Imagine creating an index like this:
CREATE INDEX IX_Events_LastDay ON dbo.Event (SentDate) WHERE SentDate >= DATEADD(DAY,-1,GETDATE())
This significantly reduces the index size, allowing for the inclusion of additional columns (e.g., field1, field2) without substantial storage overhead.
However, filtered indexes have a limitation: the filter condition must be deterministic. You cannot directly use functions like GETDATE() or DATEADD() in the WHERE clause of a filtered index definition. Furthermore, if your application queries without an explicit, hardcoded date value, the filtered index won't be utilized by the query optimizer.
Enter Dynamic Filtered Indexes
The good news is you can still leverage the benefits of filtered indexes dynamically! This involves a scheduled process to recreate or update the filtered index with a specific, current date value. Additionally, you can create a view that incorporates the same date filter, allowing your application to query a consistent, filtered dataset.
Here's a step-by-step approach:
Create a Stored Procedure to Refresh the View: This stored procedure generates or alters a view that filters data based on a dynamic date, ensuring the view always reflects the desired timeframe (e.g., the last day).
CREATE OR ALTER PROCEDURE [dbo].[refresh_VLastDayEvent]
AS
BEGIN
    DECLARE @getdate VARCHAR(16) = CONVERT(DATE, DATEADD(DAY, -1, GETDATE()));
    DECLARE @Stmt NVARCHAR(MAX) = 'CREATE OR ALTER VIEW dbo.VLastDayEvent AS
    SELECT id, serialNumber, type_id, sent FROM Event WHERE [sent]>= ''' + @getdate + ''' ';
    EXEC sp_ExecuteSQL @Stmt;
END
Schedule a Daily Job to Reindex and Refresh: Schedule a SQL Server Agent job to run daily. This job will first refresh the view (Step 1) and then reindex your filtered index. The DROP_EXISTING = ON option ensures the index is recreated with the updated date, and it's remarkably fast for a single day's data because it leverages the existing index for sorting.
On step1, Refreshing the view first is better as the index is covering the new date filter (in the future).
On step2, reindex the filtered index.
-- step 1
EXEC [dbo].[refresh_VLastDayEvent]
-- step 2
USE [<DbName>];
GO
SET QUOTED_IDENTIFIER ON;
DECLARE @getdate VARCHAR(16) = CONVERT(DATE, DATEADD(DAY, -1, GETDATE()));
DECLARE @DropExisting NVARCHAR(16)= 'ON';
DECLARE @stmt NVARCHAR(MAX) =
'
CREATE INDEX FIX_event_LastDaySent ON dbo.Event ([sent])
INCLUDE (field1, field2)
WHERE [sent] >= '''+@getdate+'''
WITH (ONLINE = ON, DATA_COMPRESSION=PAGE,DROP_EXISTING = '+@DropExisting+')
';
PRINT @stmt;
EXEC sp_ExecuteSQL @stmt;
Important: Choose ONLINE = ON or OFF based on your SQL Server edition and availability requirements.
In case your schedule does not run or fail, the job is still safe-to-run the next time as the index is still existing thanks to the DROP_EXISTING option.
Tangible Results
By implementing dynamic filtered indexes, our clients experienced a dramatic improvement in dashboard performance:
- Lightning-Fast Dashboards: Real-time dashboards querying the last week's orders or last day's events became incredibly responsive.
- Elimination of Key Lookup Costs: Queries now directly hit the highly optimized filtered indexes, eliminating costly key lookups.
- Minimal Storage Footprint: The indexes are significantly smaller, drastically reducing storage requirements.
- Elegant and Fast Solution: The scheduled maintenance is efficient and streamlined.
In practical terms, queries that previously struggled now complete in single-digit milliseconds. For example, on an Event table with 2 billion rows (800 GB), an aggregate query (like COUNT) on the VLastDayEvent view returned in just 131 milliseconds of elapsed time, with only 3657 logical reads.
Example:
set statistics io on
set statistics time on
select count(*) FROM dbo.VLastDayEvent WHERE sent > '2025-07-24'

SQL Server parse and compile time:
   CPU time = 0 ms, elapsed time = 0 ms.
SQL Server parse and compile time:
   CPU time = 0 ms, elapsed time = 0 ms.

(1 row affected)
Table 'Event'. Scan count 18, logical reads 3657, physical reads 0, page server reads 0, read-ahead reads 0, page server read-ahead reads 0, lob logical reads 0, lob physical reads 0, lob page server reads 0, lob read-ahead reads 0, lob page server read-ahead reads 0.

 SQL Server Execution Times:
   CPU time = 126 ms,  elapsed time = 131 ms.
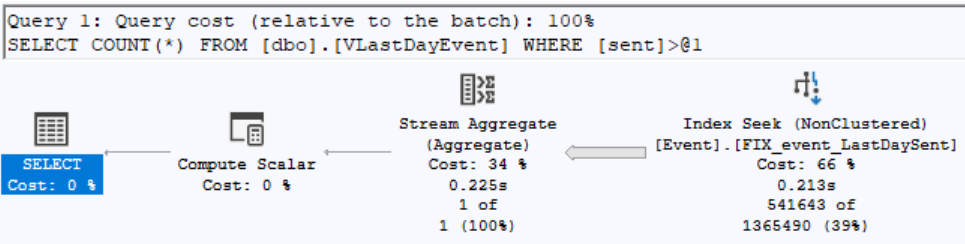
With execution plan:
(note that the index filetered is used and the seek retrieves "only" 541K rows out of the index view (1.3 million) on a table that has 2 billion rows.
Obviously, one can add more fields onto the index if needed to be filtered or indexes even more (both key and included columns).
This approach offers a powerful and elegant solution to a common performance bottleneck, allowing you to deliver truly real-time insights without compromising on database efficiency.
Do you have a specific real-time dashboard or data analysis challenge where you think dynamic filtered indexes could be beneficial?